Housing Needs Assessment
As part of OHFA's Annual Plan, the Housing Needs Assessment (HNA) uses a wide range of state data to identify the scale and scope of the state's housing challenges. The Assessment evaluates Ohio's current housing landscape to gauge housing needs, identify gaps, and highlight key trends. Beyond its role in the Annual Plan, findings from the Housing Needs Assessment inform OHFA's programmatic and policy decisions throughout the year, such as the Qualified Allocation Plan (QAP), to ensure that every Ohioan has access to safe, affordable housing.
The following Executive Summary highlights the key trends occurring within Ohio related to affordable and accessible housing.
- Fiscal Year 2020 Housing Needs Assessment – Executive Summary (5.44 MB Adobe PDF File)
Terminology Guide
– AMI – Area Median Income is the midpoint of a region's income distribution – 1/2 of families in a region earn more than the median and 1/2 earn less. These local limits help identify eligibility and affordability based on specific regions.
– ELI – Extremely Low-Income, earning at or below 30 percent of area median income (AMI)
– Housing Cost Burden – Spending above 30% of one's household income on rent and utilities
– Severe Housing Cost Burden – Spending above 50% of household income on rent and utilities
Executive Summmary
Ohio's Renters Are Cost Burdened
In 2018, nearly half (46%) of Ohio's renters experienced housing cost burden, meaning they spent above 30% of their household income on rent and utilities. Almost a quarter of all renter households (24%) experienced severe housing cost burden, meaning they spend more than 50% of their income on rent and utilities. When housing costs are higher than 30% of a household's income, it limits the household's ability to afford other daily needs, creating real challenges.
These challenges are not just seen in big cities, housing cost burden is a challenge throughout all of Ohio. In every county at least 1 in 8 renter households is severely cost burdened.
Some of this cost burden is related to rising rents. Adjusted for inflation, median gross rent increased by 5% from $729 per month in the 2008–2012 five-year period to $764 per month in 2013–2017. While incomes have been rising since the recession, growth in median income has yet to catch up with rent increases. Some of the largest rent increases are in the southeastern and northwestern regions of the state.
Change in Inflation-Adjusted Median Gross Rent, 2008–2012 to 2013–2017
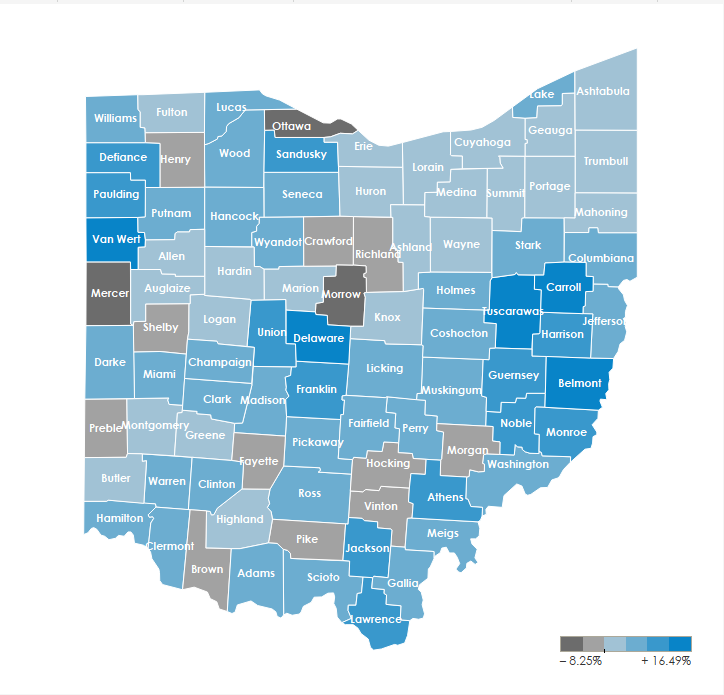
Source: ACS 5-Year Estimates, U.S. Census Bureau, Table B25064
Overall, there is a lack of affordable housing for low income renters. There are only 43 available and affordable rental units per 100 ELI renter households. All 88 counties have a shortage of rental housing for ELI renters. Only 14 counties are meeting more than half of local need for ELI renters.
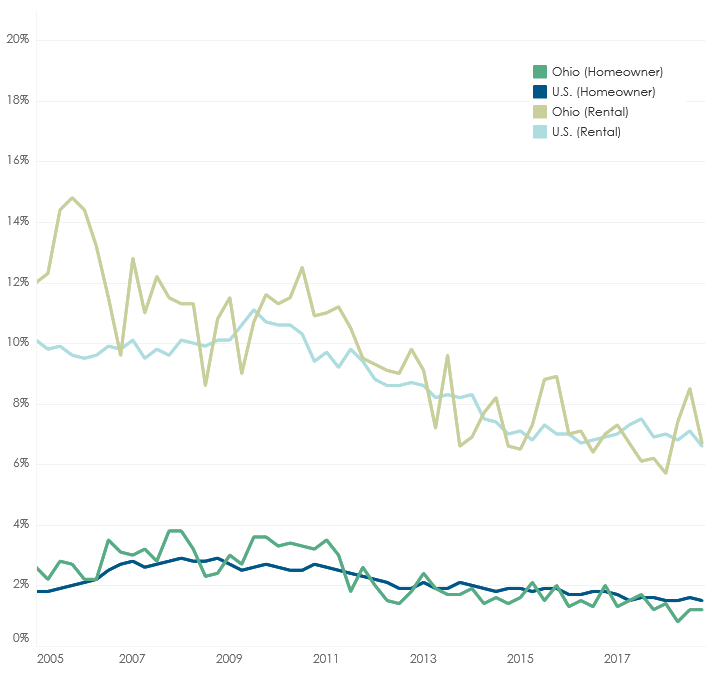
Ohio Has Seen A Small Decline in Overall Cost Burden, But Low-Income Renters Face A Growing Challenge
Statewide, the share of Ohio renters who experienced severe housing cost burden declined from 2010 to 2017. This decline was faster than the national rate. Similarly, Ohio had a smaller percentage of renters who were severely cost burdened than the national average and many neighboring states (PA, MI, IN).
Prevalence of Severe Rent Burden in the United States and Ohio
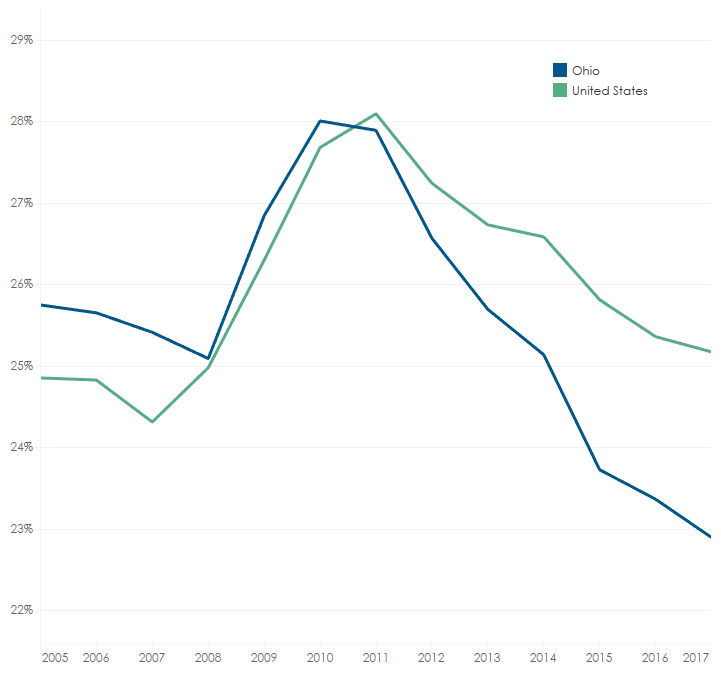
Source: American Community Survey (ACS) One-Year Estimates, Tables B25070 and B25106
Prevalence of Severe Rent Burden in Ohio and Neighboring States
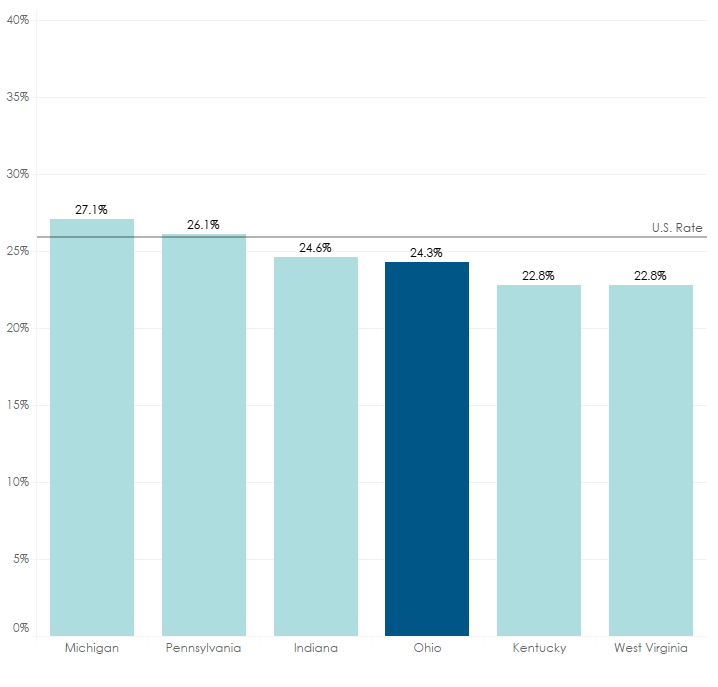
Source: American Community Survey (ACS) One-Year Estimates, Tables B25070 and B25106
Despite this positive change, a different story emerges when looking at these trends by income group. Severe housing cost burden was concentrated among Ohio's low and moderate income individuals. 71.2% of ELI Ohioans and 21.5% of low-income Ohioans experienced severe housing cost burden, compared to <1% of Ohio's higher earners. Lower income Ohioans are also experienced a large increase in cost burden (+15.4%), while higher income groups experienced a decline in rent burden.
Prevalence and Severity of Rent Burden by Income
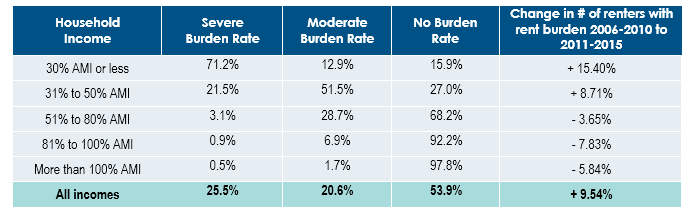
Source: 2006-2010 and 2011-2015 Comprehensive Housing Affordability Strategy Data, Table 8
Some of this divergence in cost burden is due to income. Adjusted for inflation, the increase in income for the 80th percentile outpaced the increase in rents (+5.4% vs. +3.9%), but those in the 20th percentile lagged since 2008 (+0.8% vs. +3.9 %).
Change in Inflation-Adjusted Median Gross Rent and Selected Household Income Levels Since 2006
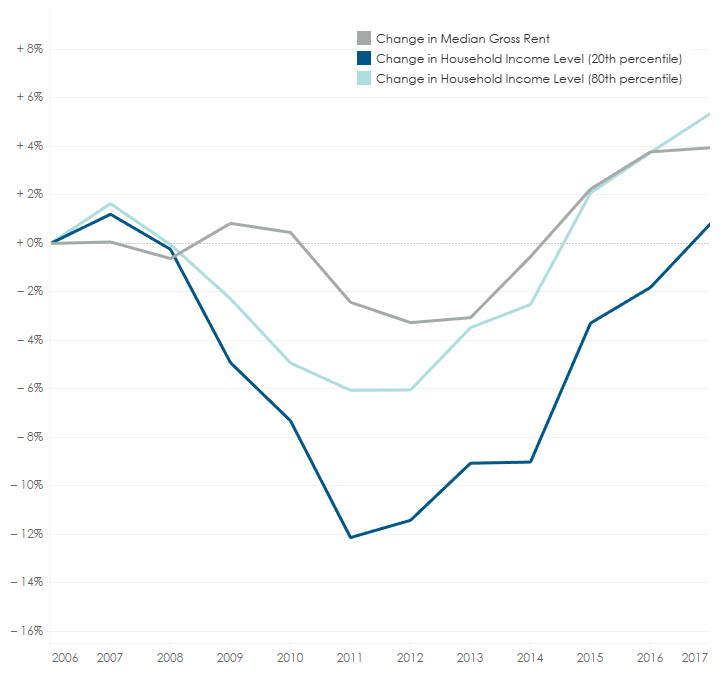
Source: American Community Survey (ACS) One-Year Estimates, Tables B19080 and B25064
As a result, the income gap between the lowest quintile of earners and the highest quintile of earners also grew between 2009 and 2015. While the increase in the gap has leveled out, we're at a higher gap now than in 2006.
Income Gap Ratio, 80th and 20th Percentiles
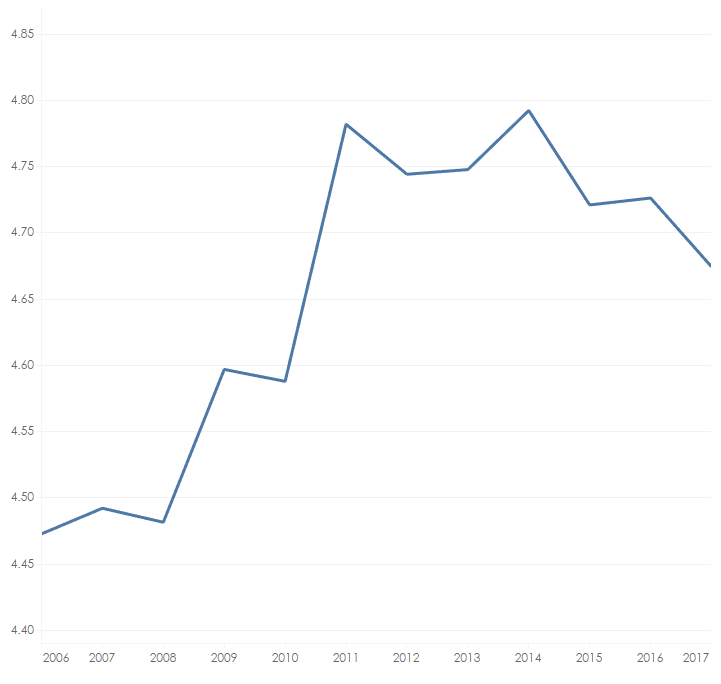
Source: American Community Survey (ACS) One-Year Estimates, Table B19080
Housing Insecurity is Increasing
Households that devote a large share of their income to rent are at higher risk for eviction or loss of housing, since any bad break could mean coming up short at the end of the month. Housing cost burden can result in many forms of housing insecurity, including eviction and/or homelessness.
In 2017 there were 105,150 eviction filings statewide: 6.7% of all renter households . As of 2016, Ohio's eviction filing rate was slightly higher than the national average. At the county level, Butler, Clark, Cuyahoga, Franklin, Hamilton, Lucas, Marion, and Richland had the highest rates of eviction filings.
Eviction Filing Rate

Source: 2017 Ohio Courts Statistical Report, The Supreme Court of Ohio and The Ohio Judicial System; 2013-2017 American Community Survey (ACS) Five-Year Estimates, Table B25003
The 2018 Point in Time count found that on a single night in January 2018, 10,249 individuals were counted statewide as living in temporary housing for homeless persons—such as emergency shelters—or on the streets. However, data from the Ohio Human Services Data Warehouse found that the number of Ohioans accessing homelessness services is actually much larger and increasing; at least 70,000 Ohioans accessed homelessness services in 2017 from one of the state's continuums of care. This represents a 20% increase from 2012.
Clients Accessing Homelessness Services by Project Type
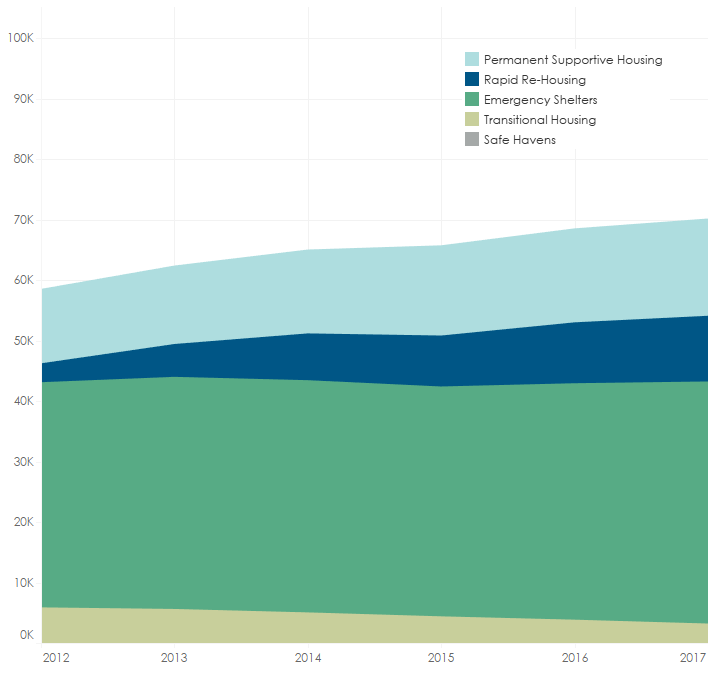
Source: Ohio Human Services Data Warehouse
Ohio Faces A Tight Housing Market
Over two-thirds of Ohio householders (67%) own their homes, which is above the national average of 64%. Homeownership fell in Ohio and the United States from 2005 to 2015, but has since stabilized, and appears to be on the rise. Ohio's foreclosure rate (0.7%), 90-day delinquency rate (2%) and negative equity share (5%) in December 2018 were all at record low levels, having fallen precipitously from the height of the recession.
Yet, Ohio's housing market faces continued challenges of limited and aging stock, and low vacancy rates. Since 2010 Ohio has added only 73,969 housing units, a net increase of 1.4%. Much of this growth has happened in suburban areas (+1.7%), while Ohio's urban cores have seen housing stock decline (–1.1%).
In addition, the housing stock is relatively old. Half of Ohio's housing units were built before 1965. Nearly one in four housing units in Ohio were built before 1940, including 30% of the state's vacant housing. While over 540,000 housing units in Ohio are vacant (10% of the state's housing stock), only 28% of them are available for sale or rent. Both homeowner and rental vacancy rates—1.7% and 5.8%—respectively are at or near their lowest levels on record, indicating a very tight housing market.
Quarterly Vacancy Rates for the United States and Ohio by Tenure
Source: Housing Vacancy Survey, U.S. Census Bureau
Ohio's Homeowners Also Face Challenges of Rising Costs
For homeowners, median monthly costs have fallen 6.8% from the 2008-2012 period, from $1,337 to a current median (real) dollar amount of $1,247.
Homeowner Costs as Share of Household Income by Mortgage Status
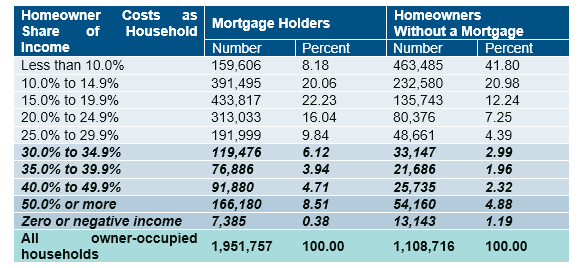
Source: 2013–2017 American Community Survey (ACS) Five-Year Estimates, Table B25091
While median monthly costs have fallen overall, Ohio's lowest income homeowners face challenges of housing cost burden. Of Ohio's lowest income populations, 68.7% of these are severely cost burdened, compared with only 2.5% of those 81 to 100% AMI or 0.5% of those earning >100% AMI.
Prevalence and Severity of Housing Cost Burden for Owner Households by Income
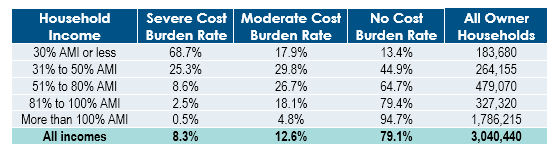
Source: 2011-2015 Comprehensive Housing Affordability Strategy Data, Table 8
For those who do not yet own their homes, homeownership is becoming financially more challenging. Ohio's median home prices have risen since the housing crisis. By the end of 2018, the median home price in Ohio ($125,767), on the rise since 2011, was more than twice the median household income ($54,077), making it unaffordable to most homebuyers.
Monthly Median Home Sales Price
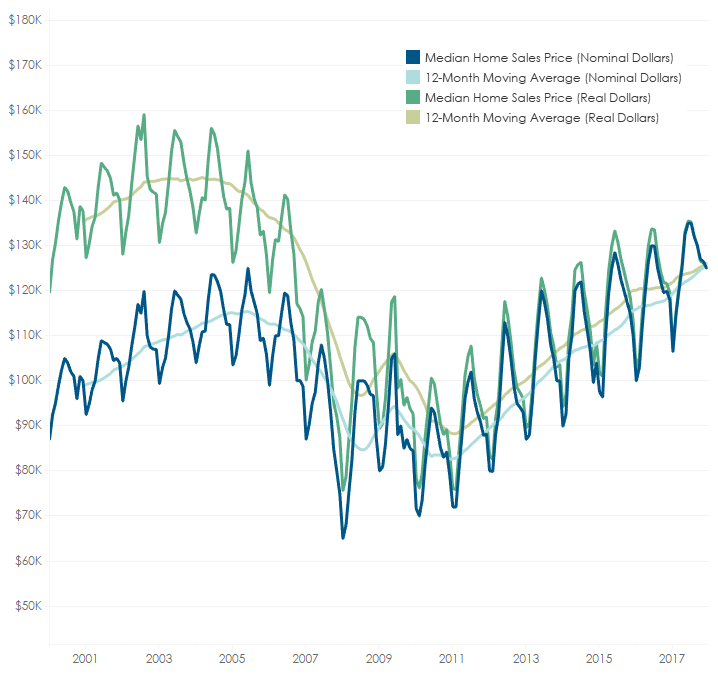
Source: Real Estate Analytics Suite, CoreLogic; Consumer Price Index for All Urban Consumers, U.S. Bureau of Labor Statistics
Ohio's Children Are Highly Affected By Housing Challenges
Housing quality and consistency is particularly important for children throughout the state. Ohio's children are more likely than adults to experience poverty; 19.8% of children and 22.8% of children under 5 are living in households below the federal poverty level (FPL), compared to 13.9% overall. Ohio ranks worse than the national average in share of children in poverty.
Poverty Rates for Ohio and Neighboring States
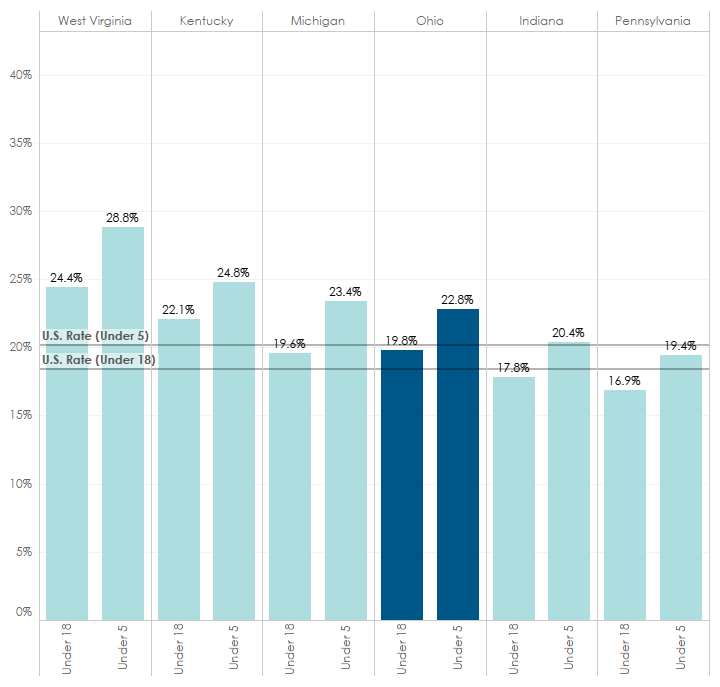
Source: Small Area Income and Poverty Estimates, U.S. Census Bureau
Children are one of the most rapidly growing populations accessing homelessness services, with almost 3,000 infants accessing services in 2017 according to the Ohio Human Services Data Warehouse. Ohio's public and community schools reported that 23,398 students lack a fixed, regular and adequate nighttime residence during the 2017–18 school year.
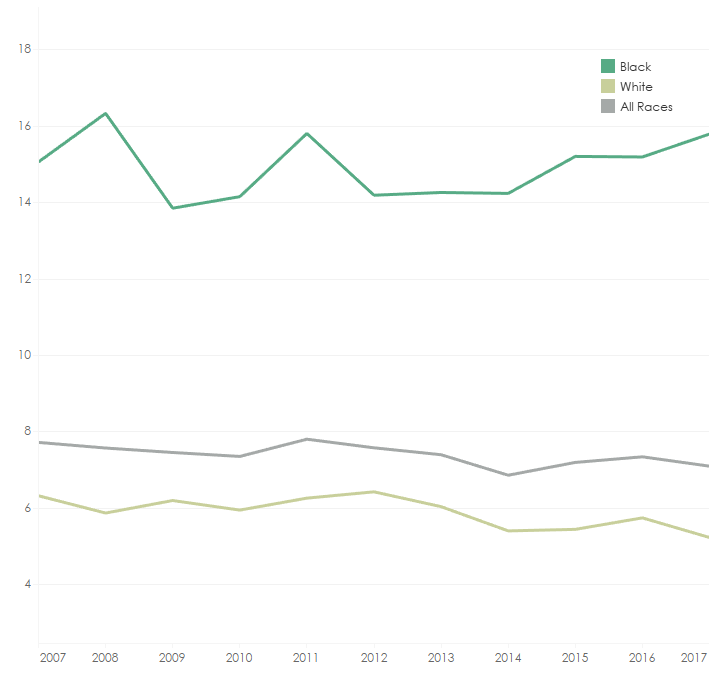
Infants are more susceptible to high mortality rates if they and their mothers experience low-quality or inconsistent housing. Seven out of every 1,000 children born in Ohio in 2016 died before their first birthday, the 8th highest rate in the U.S. The racial gap in infant mortality has been steadily increasing. Children born to black mothers are three times more likely to die before their first birthday than those born to white mothers (15.8 and 5.2 deaths per 1,000 live births, respectively).
Infant Mortality Rate per 1,000 Live Births by Race of Mother
Source: Ohio Infant Mortality Data, Ohio Department of Health
Young children are also susceptible to lead poisoning; more than two-thirds of Ohio homes were built before 1980, making them old enough to contain lead-based paint, including 425,235 homes with young children present.
Older Adults And People With Disabilities Remain Vulnerable
Ohio's aging adults are an increasingly critical population to focus on regarding housing. Ohio's share of older adults aged 65 and over is projected to increase from 16% (1.8 million) today to 24% (2.8 million) by 2040.
Older adults throughout the state are more likely to face challenges of high housing cost burden. 52% of renters and 24% of homeowners aged 65 or over were cost burdened, compared with 43% of younger renters and 17% of younger homeowners.
Many older adults live alone; one out of every nine Ohio households—or over half a million—houses a single older adult, which adds substantial challenges to maintaining the cost and upkeep of a home. As a result, older adults are increasingly accessing homelessness services throughout the state.
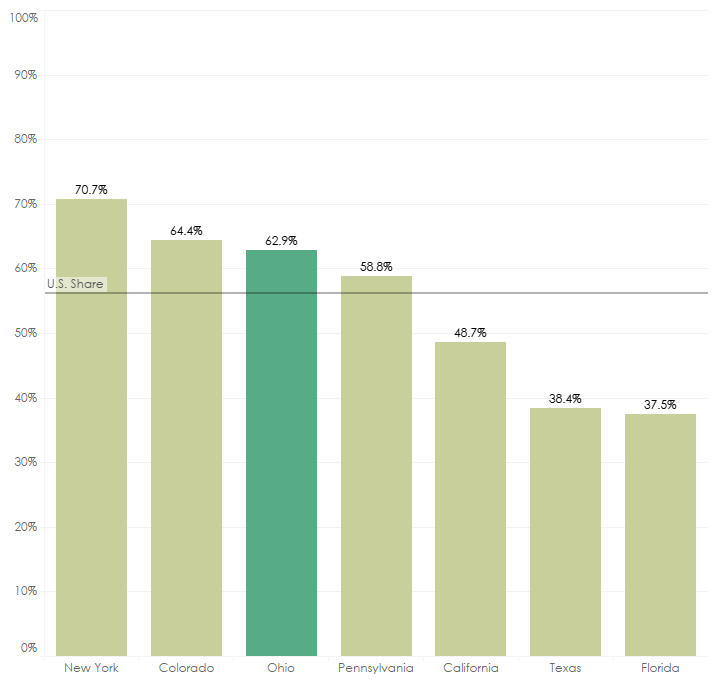
Older adults are more likely to experience other challenges, like living with a disability, that make finding a safe and suitable housing unit more challenging. One in four adults aged 65 to 74 (25%) and nearly half of adults 75 and over (48%) live with a disability. Appalachian counties have an older median age and higher rates of disability than Ohio as a whole. Despite this large number, nearly two thirds of homes in Ohio (63%) cannot be entered by someone in a wheelchair; a higher rate of inaccessibility than the national average (56%).
Wheelchair Inaccessibility for Ohio and Comparison States
Source: 2015 American Housing Survey, U.S. Census Bureau
Notes: Housing units can be entered by someone in a wheelchair if it is possible to enter from outside without climbing any steps or stairs.
Racial Inequalities Continue in Housing Access and Affordability
Racial inequality in housing persists in Ohio, due, in part to historic patterns of housing discrimination and segregation. The median household income for black householders in Ohio is $30,575, about half that of white householders of $56,395.
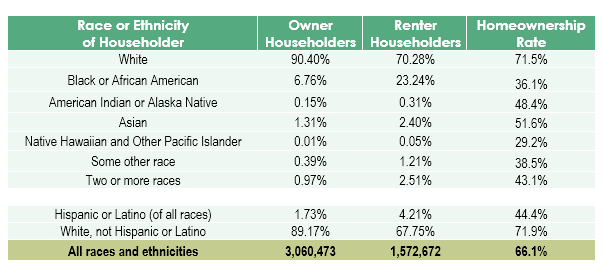
White householders are more likely to be homeowners, and less likely to experience housing problems than other racial categories throughout the state. White householders have a substantially higher rate of homeownership than all other racial categories (71.45% compared to a state average of 66.06%). Black and Hispanic renters are more likely (33% and 31% respectively) to experience severe housing problems than their white counterparts (23%).
Race and Ethnicity of Householder by Tenure
Source: 2013-2017 American Community Survey (ACS) Five-Year Estimates, Tables B25003A-I